 |

|
|
|
|
 Back to 1996 1st Quarter Table of Contents
The following paper was presented at the 25thAnnual International Conference, Nutritional Medicine Today, May, 1996 Vancouver. IntroductionOne of the purposes of an anniversary is to rejoice and reminisce. We can congratulate ourselves because orthomolecular medicine is alive and well. This is underscored by Eisenberg in The New England Journal of Medicine.1 He makes th point that in 1990 Americans made an estimated 425 million visits to providers of unconventional therapy at an out-of-pocket cost of $27.60 per visit. Two other points should be noted. First, the total number of persons visiting alternative doctors was significantly larger than those attending traditional practitioners. Secondly, the vast majority of such persons had already consulted an allopathic or osteopathic practitioner. The other consideration in a celebration is to reflect on a number of pertinent questions. What is the purpose of orthomolecular medicine? How does one measure one’s success or failure? What are the common denominators in the different expressions of orthomolecular medicine and dentistry? What happens to an individual who is successfully versus unsuccessfully managed? On this, the twenty-fifth birthday of orthomolecular medicine and dentistry, we shall look at some of these questions and hopefully come up with some reasonable answers. If you are lost, you might try a map. It may help you identify where you are, where you want to go, and the direction and distance. The same is true medically. For example, there is the 1.Park Tower 904/906, 2717 Highland Avenue South, Birmingham, Alabama 35205-1725 USA incontestible fact that seemingly similar people subjected to the same external stressors so often behave differently. Why is it that similar people treated by the same therapist with the same regime react widely? One gets much better; one is unscathed; and there is the possibility of even getting worse. Since the external component is the same (meaning the same air we breathe, the water we drink and the food we eat), the answer must be that the difference lays in the milieu interieur (also referred to as resistance/susceptibility, constitution, predisposition immuno compentence, harmony, balance, homeostasis). These are the questions that serve as a basis for orthomolecular medicine and dentistry. The purpose of this presentation is to analyze the factors that go to make up homeostasis, how it can be measured and mapped, and its clinical implications. The Nature/Nurture Debate 2One of the still-unanswered burning questions is, “Where does homeostasis (the internal world) come from?” The quick and obvious answer is that our coping system is a function in part of our genetics. As a matter of fact, the radio and television medias as well as the newspapers make it sound as if, on a monthly basis, we are regularly discovering new chromosomes for our diseases. Just as we inherit a long nose or stubby toes, so we acquire in part flapping ears or a small thyroid. And this is the basis for the now-discovered recognition of a marker for diabetes mellitus, schizophrenia, cystic fibrosis, breast cancer and, would you believe, even bed-wetting! The flip side of this question is that we are also, in part, a function of the external world we live in. We know that tall people tend to marry tall people, Catholics usually prefer Catholics, rich folks more often than not marry rich folks and people marry from the same locale. But the central ingredient is that we are a function of the air we breathe, the water we drink and the food we eat. So, the cardinal issue is, “What are the relative contributions of nature versus nurture?” Four items serve as an excellent prelude to and justification for this dicsussion on the role of genetics versus the environment in the genesis of health and homeostasis. Firstly, it is abundantly clear that the debate is current and very much alive. This is apparent as judged by the fact that reports, editorials and letters appeared in 1988 in two of our most prestigious scientific publications, Nature and The New England Journal of Medicine. Secondly, the continuing and prevailing conclusions are, “Most major chronic diseases probably result from the accumulation of environmental factors over time in genetically susceptible persons.” Hence, we are still currently unclear regarding the relative contributions of the environment and inheritance. It would be helpful to know what the nature/nurture ratio is. Obviously, the number would dictate the direction of subsequent research efforts and clinical pursuits. In other words, if the prevailing evidence suggests that environment is the principal factor, then common sense would favor more emphasis in nurture research. Thirdly, present conclusions are based on conventional familial models including parents and children, twins, siblings, the orphaned and adopted. Finally, the least studied matrix, with the greatest possible contribution, is spouse-likeness. This follows from the cliché that “people who live together begin to look alike.” But what about the air we breath, the water we drink and the food we eat? We, at the University of Alabama Medical Center, have studied familial aggregagtion in a group of dental practitioners and their spouses. In fact, we have published approximately 20 papers on this subject. The model we have employed is exemplified by the study serum cholesterol in the husband/wife. (Table 1). Two hundred sixty one couples were studied in terms of their serum cholesterol. The dental practitioners’ scores were then compared to age matched unrelated women. Finally, the two female groups Table 1Correlation coefficients for serum cholesterolLine Numbers/pairs r p
* Statistically significant correlation coefficient were compared. This format provided us with the opportunity of raising (and hopefully answering) three questions:
Line 1 of Table 1 shows a highly statistically significant correlation of serum cholesterol (r = +0.361, p < 0.01). Hence, in answer to the first query, the evidence suggests that husbands and wives seem to demonstrate similar serum cholesterol levels. In other words, men with high serum cholesterols, in general, seem to be living with women with elevated serum cholesterol. In contrast, males with low cholesterols appear to be associated with females with low cholesterols. An examination of the men compared to the women age-matched against their wives (line 2), showed no such significant relationship (r = 0.075, p > 0.05). Therefore, in answer to the second point, there is no significant correlation coefficient between serum cholesterol concentrations in men and women unrelated by marriage. Finally, the issue arises as to whether couples, consciously or otherwise, select each other by virtue of their lipid metabolism. The point has already been made that Catholics tend to marry Catholics, tall people marry tall people, etc. But, can you imagine picking your future mate because of his/her serum cholesterol? Lines 4, 5 and 6 of Table 1 show the correlation coefficients of the married groups in terms of advancing age. Line 4 pictures the men less than 40 years of age and their spouses. In this, the relatively youngest combination, there is no statistically significant connection (r = 0.176, p > 0.05). While this shows convincingly that the cholesterol is not the deciding factor in spouse selection, it still leaves open, what is? In contrast, in the next age group (the men in the 40s), the relationship sharpens and becomes significant (r = +0.279, p < 0.01). Finally, in the oldest subset (the men are 50+ years of age), the correlation becomes even more statistically convincing (r = 0.464, p < 0.01). Thus, in answer to the third and final question, this clearly suggests that the pattern must, in part, be environmentally-inspired. While there is no question that genetics play an important role (Chinese parents still seem to have Chinese children), it would appear that the environment demonstrates a cardinal (possibly even primary) consideration in the causation of health and homeostasis. In any case, it becomes a more serious practical consideration since, it is easier to modify nurture than nature. While the spouse-likeness mold is relatively simple, inexpensive, and highly convincing in differentiating inheritance from the environment, it is not without its problems as we have seen earlier. The question is what is the stuff of which our internal world is made? This bubbling and busy world consists of thousands of enzymes involved in thousands of physiochemical reactions. And the next question is where does the stuff come that makes possible these reactions? No argument. It is familial! In other words, there is the known association that we got it from our papas and mommas by means of chromosomes and genes. Hence, familial can and often does suggest a genetic influence. But, as we have just seen, it need not be so. It may be familial because the whole family has the same lifestyle. For example, they all eat, drink and exercise the same. Therefore, familial may indicate nongenetic factors. This discussion hopefully recognizes the semantic trap. What we have tried to do is clarify familial (genetics) versus familial (environment) by utilizing an unusual model, the husband/ wife, who are generally not genetically related but surely environmentally close. The evidence is clear that the environment must play a dominant role because of its intrinsic influences as well as the fact that, from a practical standpoint, it is easier to alter nurture than nature. This then addresses some of the earlier questions regarding the uniqueness of orthomolecular medicine and dentistry. Human Health/Homeostasis and Blood GlucoseIt is generally recognized that the nonlethal range of blood glucose is from 20 to 1500 mg%.3 Within this range, there is a segment that can be viewed as optimal or ideal. In non-orthomolecular circles, measuring blood sugar is intended purely and simply to sort out the diabetic from the nondiabetic. For our purposes, the paradigm will be a very simple study of the appearance of the gingiva before and after the cleaning of the teeth. This is graphically portrayed in Figure 1. Perhaps this will help answer the question, “Why do seemingly similar problems treated seemingly similarly (even by the same therapist) often net vastly different results?” Shown on the abscissa are the mean gingival inflammation scores for a group of presumably healthy subjects prior to scaling. As one moves from left to right the gums are increasingly poorer (the number is higher). Depicted on the ordinate are the grades for the same group after cleaning and polishing of the teeth. (Proceeding upward the gingivae becomes worse). It is obvious that most of the subjects demonstrated an improvement in gingival inflammation (shown in the dots representing patients below the diagonal line). A few were unchanged (on the line) and some actually worsened (above the diagonal line). Here is a graphic representation of what has just been described, namely the variability in response to a simple therapeutic experience. Now let us analyze this study in greater detail. For our purposes, the clinical element to be examined is periodontal disease as measured by gingival inflammation. Forty-five presumably healthy (deemed-to-be-nondiabetic) males, ranging in age from 20 to 50 years, were employed for this demonstration. At the first visit, specific gingival inflammation areas were graded on a four-point scale ranging from zero for no gingival inflammation to three for classical gingivitis. The numbers were then added and divided to produce average measured sites. Hence, 0.0 represents the ultimate perfectly healthy gingiva; 3.0 the worst possible clinical state. Obviously, most of the numbers are somewhere in between. But, the most critical point to remember is that the higher Figure 1Comparision of gingival response to scaling in 45 subjects.1.0 final 0.5 gingivitis scores 0.0 0.0 0.5 1.0 1.5
Initial mean gingivitis scoresthe gingival score, the sicker the gums. At this initial visit, venous blood glucose was measured. One half the mouth (right or left) randomly chosen was scaled. The other half was used as a control. Two weeks later, each person was gingivally reexamined by the same clinician with no knowledge of the earlier scores. Blood glucose was also remeasured. It is obvious that different subjects responded differently to the same therapeutic approach (in this case, scaling as shown earlier in Figure 1). Why? Certainly the oral environment was not the same in all the test group (some people had better gums than others initially). Perhaps with other local therapy (e.g. consistently good oral tooth brushing on a daily basis), the gingival response would have been more consistent. Clinical experience says this is likely. But, the general observation also indicates that there may be other host factors. Figure 2 graphically portrays the initial blood glucose scores on the horizontal and the final values on the vertical axis. Think about it this way. Being within the rectangle is better ( it suggests more desirable health and homeostasis) than being outside. Table 2 shows the means for the two groups before and after scaling. Two points deserve special mention. First, the mean Figure 2 Blood glucose levels before and after therapy viewed by different standards of normality.
40 60 80 100 120 Initial nonfasting blood glucose (mg. %)gingival score (line 1) or the subjects with the presumably better blood sugar (60-100 mg%) is lower and better (0.6) than the group (line 2) with the poorer sugar state (0.8) prior to scaling. Second, the better glucose state also showed a lower gingival score postscaling 0.4 versus 0.5 (lines 1 and 2). Thus it seems, within the limits of this pictorialization, that the responses to prophylaxis are different and more predictable when judged in view of Table 2Mean gingivitis scores before and after scaling. lines blood glucose sample mean gingivitis ranges size initial final
a blood sugar marker. Clearly, as we pointed out earlier, there is general disagreement among investigators regarding so-called good and bad blood sugar. Therefore, let us restudy the observations in the light of other more restricted blood sugar paramaters. In Figure 3, the peripheral box describes the initial and final blood glucose levels for a slightly more compressed normal limit (65-95 mg%). By this delineation, now there are fewer so-called healthy people, 37 (Table 2, line 3) instead of 41, that fall within the physiologic area; eight now may be regarded as pathologic (line 4). The gingival findings are summarized in Table 2. First, it is well to point out that the mean gingival rating for those with the more satisfactory blood glucose range is less, 0.5 (line 3) than for the relatively more pathologic group, 0.8 (line 4). Second, the prescaling gingivitis score at the start is lower (better), 0.5 (line 3), for those with blood glucose levels of 65-95 mg% than for those with a conventional range (earlier described) of 60-100 mg%, 0.6 (line 1). Third, the final postscaling mean gingivitis score is lower in the 65-95 group than in those with blood glucose levels below 65 and above 95 mg%, 0.3 (line 3) versus 0.5 (line 4). With decreasing size, the second and third squares of Figure 3 describe the patterns when one considers an increasingly more restricted blood sugar. The final conclusion is that those subjects (line 7) with the so-called best (the “ideal” or the most homeostatic) blood sugar (75-85 mg%), show, following the cleaning and polishing of the teeth (0.2), the best gingival state (closest to 0). This demonstration of the meaning of blood sugar and homeostasis is presented because of its simplicity and the fact that it lends itself to reasonably precise measurement. Much has been written about the mechanisms which control homeostasis (the steady state). Relatively little attention has been accorded the study of how steady is the steady state. Dubos in 1959, Figure 3 Blood glucose levels before and after therapy viewed by different standards of normality.
40 60 80 100 120 Initial nonfasting blood glucose (mg. %) in his writings about Claude Bernard and homeostasis, made the following statement: He (Claude Bernard) emphasized that at all levels of biological organization, in plants as well as in animals, survival and fitness are conditioned by the ability of the organism to resist the impact of the outside world and maintain constant within narrow limits the physiochemical characteristics of its internal environment. As we have seen, this means in terms of blood glucose, a narrow range of 75-85 mg% which is much more desirable than the nonlethal range of 20 to 1500 mg% mentioned earlier. The next question is how does all of this play out in clinical practice? We have studied blood glucose as it relates to many other diseases. Also, we have examined other biochemical parameters in terms of these same disorders. For example, we have cited elsewhere two refractory cases (granuloma and lupus erythematosis) and how they have responded to changes in blood glucose and other disorders.4 Human Health/Homeostasis and Blood Lipids From the long and extensive discussion of blood glucose and homeostasis, it is easy to draw the conclusion that this is the only relationship. Just to emphasize that such parallelisms occur with many, if not most, biochemical parameters, let us look at serum cholesterol. First and foremost, what is the “ideal” serum cholesterol? There is increasing evidence that the present physiologic limits are too broad. For a long time, 150 to 300 mg% was regarded as normal. To answer this question, we employed 1281 doctors and their spouses.5 Clinical state was graded by the Cornell Medical Index Health Questionnaire (CMI). The CMI is a self-administered test consisting of 195 questions. Each question is answered by circling the word “yes” or “no”. The questions are phrased so that the affirmative answers indicate pathologic findings (clinical symptoms and signs). The clincial findings in this report are the total number of affirmative CMI responses. Table 3 (line 1) shows1281 subjects with a CMI range from 0 to 125, an average CMI score of 16, a serum cholesterol spread from 110 to 520 mg% with a mean and one standard deviation of 224 +-44 mg%. Moving downward through the Table (lines 2, 3, etc), it is obvious that progressively fewer symptoms and signs are paralleled with a systematically lower mean cholesterol score and a narrower range. Thus, in the healthiest group (line 8), the very low and very high cholesterol scores have been eliminated so that the range has shrunk from 110 - 520 (line 1) to 176 - 239 (line 8). The evidence presented here from a study of presumably healthy doctors and their spouses, supported by much other data, suggests that the “ideal” nonfasting serum cholesterol level may approach approximately 200 mg% plus or minus the experimental error involved in producing the test. To further understand the relationship between homeostasis and cholesterol, we employed 40 presumably healthy junior dental students.6On Monday of a week, gingival state was graded. The students were then instructed to eliminate, as far as possible, refined carbohydrate foods from the diet. Gingival state was regraded on Friday of the same week by the same examiner with no knowledge of the earlier findings. At both visits, postprandial serum cholesterol was determined. It is clear (Figure 4) that the mean Table 3 Relationship of nonfasting serum cholesterol and total clinical findings in a presumably healthy male and female sample.
* CMI, Cornell Medical Index Health Questionnaire of the mean gingival scores (Table 4) at Journal of Orthomolecular Medicine final mean gingival scor es gingival scores were lower in most of the subjects following the three-day experimental period. Shown on the abscissa are the initial mean gingival grades; on the ordinate the final values. Thirty-three or 82.5% improved (below the diagonal); five or 12.5% were unchanged; two or 5% worsened. More importantly, there is even considerable variability within the group which improved. This was seen earlier in the case of gingival infammation and blood glucose (Figure 1). There are several possible reasons for such variations and these have been cited earlier with regard to blood glucose and gingival state. There are two additional points of interest. First, what is the effect of refined carbohydrate deprivation upon serum cholesterol? Secondly, how does the gingiva of 144 to a high of 256 mg%. Figure 5 portrays the initial (on the abscissa) and final (on the ordinates) serum cholesterol scores for the 40 subjects. On the basis of (until recently), traditional standards of 150-250 mg% (represented by the largest rectangle), three of the group could be the initial visit shows that the three with the most pathologic cholesterol scores (line 2) have a mean gingival rating of 0.67; those within the physiologic limits of 150 250 mg% (line 1) an average of 0.58. Thus, it seems that the more physiologic lipid pattern parallels the healthier gingival score. At the second visit, the trend is the same. The individuals with the pathologic values show a higher mean gingival grade (0.47 versus 0.37). As one shrinks the cholesterol ranges (Figure 5), the smaller sqares delineate pro gressively more restricted acceptable lim its (160-240, 170-230, 180-220, and 190 210). Table 4 summarizes the mean gingival scores in the light of these progressively more narrow norms. Several points warrant reflect this change? particular note. Firstly, in all instances at At both visits, serum cholesterol was the initial visit, the mean gingival score measured. The scores ranged from a low within the rectangle (presumably representative of more physiologic metabolism) is lower than outside the square. Thus, 0.58 versus 0.67 with limits of 150-250 mg%; 0.46 versus 0.60 in the case of 190 210 mg%. Secondly, the smallest rectan gle (representative of the most narrow lim its of 190-210 mg%) parallels the lowest considered pathologic. An examination mean gingival score (0.46), line 9, which most closely approaches zero, the most Figure 4 optimal gingival state. Thirdly, at the sec-Comparision of gingival response to ond visit, the pattern is essentially that low refined carbohydrate dietdescribed above under the first item, namely, the mean gingival score within the rectangle is lower than outside. The most 1.0 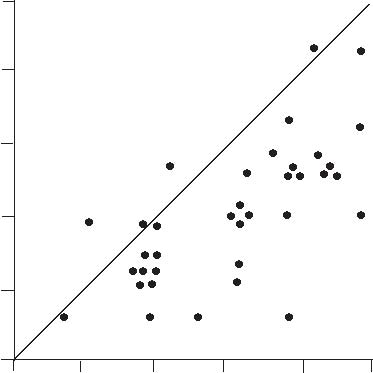 desired gingival score (closest to zero, 0.28) is found associated with the most rigid serum cholesterol standard of 190-210 mg%. This, it should be recalled, is quite .8 .6 consistent with out “ideal” serum cholesterol earlier discussed (Table 3). Lastly, the pattern here for gingival state and cho .4 lesterol is precisely that earlier described with blood glucose and gingival state in .2 terms of scaling and polishing the teeth (Table 2). The critical point is that, once 0 again, we have the extraordinary oppor 0 .2 .4 .6 .81.0 tunity of examining a problem, gingival initial mean gingival scores pathosis. It appears that one of our most significant negative factors is the refined carbohydrate foodstuffs. It is also apparent from this demonstration (supported by much in the literature) that the elimination of the simple sugar foods contributes to a more homeostatic lipid picture as judged by serum cholesterol. Other Considerations There are additional dietary and nondietary factors which should be considered in the homeostatic process. For example, the importance of water is unquestioned. However, most considerations about water deal with the number of glasses to be consumed per day. It is generally agreed that the average individual needs about eight to ten glasses on a daily basis. What is not emphasized is that it is possible to eat water which is actually what happens when one consumes fresh fruits and vegetables. There are other advantages to these foods such as fiber. Also, fresh fruits and vegetables are high in the antioxidants, a subject which is gaining in importance. As a matter of fact, it is our considered opinion, and supported by others, that the Figure 5 Blood glucose levels before and after therapy viewed by different standards of normality. • 250 Final serum 230 cholesterol 190 scores 170 150 150 170 190 230 250 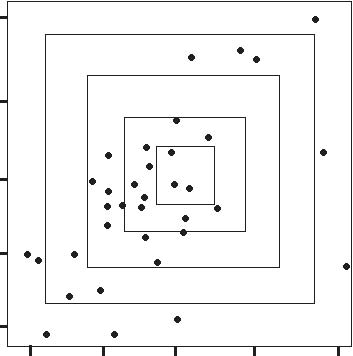 Initial serum cholesterol scores antioxidants would serve us better if they were started earlier, given in larger amounts, and for longer periods of time 7. While much has been writen about diet and nutrition, the general emphasis has been on what to eat. Very little attention has been accorded when and how to eat. The literature shows very clearly that grazing is desired over gorging. Every re- Table 4Mean pre- and post-diet gingival scores initial final serum mean mean cholesterol sample gingival gingival lines ranges size scores scores
0.38 0.35 0.35 0.28 ported study corrobates that as one eats less more times a day, every clinical, physiologic and biochemical parameter examined improves8. In addition, there is proof that the more one tampers with food (e.g. cooking), the less nutritious it is. As one increases the percentage of raw foods in the diet, every metabolic process which has been examined adds to the welfare of the organism. While the examples given here are dietary, in the interest of time and space, other alternative procedures not cited here, can produce the same or similar results. Summary and Conclusions Clearly, we have been dealing with relatively simple systems such as one or two measures in time in terms of single reflections of homeostasis. Obviously, in real terms, human health and homeostasis are multifactorial. In other words, it should be clear from these few studies that we are still dealing with primitive homeostatic charts. Other biochemical tests, besides blood glucose and serum cholesterol, should be investigated. Different lifestyle characteristics besides diet and physical activity ought to be scrutinized such as sleep, pollution, tobacco, alcohol. Finally, the evidence suggests that the more points in time for more parameters that are measured, the more precise will be the final homeostatic map. It would seem that the model would slowly improve as one proceeds from a cube to the ultimate multifaceted model (and there is even scriptural support), a perfect sphere (Figure 6). The model would fit best the old adage by Jacques May, “It is as though I had on a table three dolls, one of glass, another of celluloid, and a third of steel, and I chose to hit these three dolls with a hammer, using equal strength. Why does the glass doll Figure 6The sphere as a perfect homeostatic model 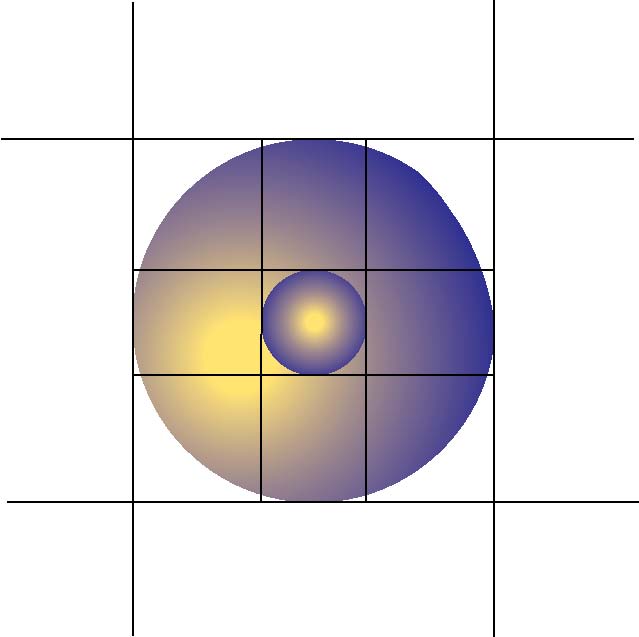 shatter, the celluloid doll only scar, and the steel doll emit a beautiful musical sound?” In the final analysis, if you are lost, a map will tell you where you are, the direction and distance you must go to reach your destination. And so it is medically. For that reason, adding mapping to measurability should be the hallmark of orthomolecu-lar medicine and dentistry. References
Bigger Meaning. Journal of Applied Nutrition, 1994; 46: 37-51.
| ||||||

This website is managed by Riordan Clinic
A Non-profit 501(c)(3) Medical, Research and Educational Organization
3100 North Hillside Avenue, Wichita, KS 67219 USA
Phone: 316-682-3100; Fax: 316-682-5054
© (Riordan Clinic) 2004 - 2024c
Information on Orthomolecular.org is provided for educational purposes only. It is not intended as medical advice.
Consult your orthomolecular health care professional for individual guidance on specific health problems.
 Download The Full Text Article in (PDF)