 |

|
|
|
|
 Back to 1995 1st Quarter Table of Contents
Some years ago in a stimulating, and at times irritating, book entitled "Apes, Men and Morons," anthropologist Earnest A. Hooten made the comment that it is a very short-visioned medical science which works backward from the autopsy table, rather than forward from the cradle.1 He sees no bright future for scientific achievement in the healing arts by limiting its responsibility to repair work and curative procedures. For practical purposes and as an immediate working hypothesis, predictive medicine may be defined as the clinical discipline designed to anticipate disease in man.2 The intent, by such an approach, is to foretell illness before it erupts in its classical form. Thus, predictive medicine allows for primary prevention (prevention of occurrence). This philosophy immediately sets predictive medicine apart from conventional medicine where the cardinal theme, by act if not by word, is the identification of existing disease with subsequent treatment and, at best, secondary prevention (prevention of recurrence). The concept of risk is an ancient one. Consultation with the Delphic oracle or prediction of the health of inhabitants of a city from a survey of the city's topography as described by Hippocrates are both early forms of risk assessment. The 18th and 19th centuries provided many instances of increasingly sophisticated studies identifying risk analysis. For example, in 1775, Sir Percival Pott described the association between chimney sweeping and scrotal cancer. These observations, however, were fortuitous, not the result of deliberate epidemiologic studies to identify risk analysis. The deliberate search for odds and ends, the predictive relationships between risk indicators and the incidence of disease and 1. Park Tower 904/906. 2717 Highland Avenue South. Birmingham. Alabama 35205. death, and the quantification of the relative risk attributable to these indicators have only recently become possible. This new capability of risk estimation can be ascribed to several developments: (1) new statistical and mathematical techniques that support the study of the relationships between predictive variables and outcome events in health have now become available, (2) the widespread ability and decreasing cost of computers have made it possible to analyze great quantities of information from large research studies, and (3) recent advances in understanding the pathophysiology and biochemistry of disease processes have uncovered risk analysis. Traditional medicine focuses on the diagnosis and treatment of disease. The patient's medical history, physical examination, and laboratory test are designed to provide signs and symptoms which, when considered together, will suggest a diagnosis. The intent is the immediate detection and identification of disease. Risk estimation (odds) call for a different approach to information gathering, the collection of data that will permit outcomes (ends) to be anticipated over a much longer time frame, one measured in years, if not in decades. The Standard ApproachThere are, and have been for some time, many examples of risk associations. Recent studies have focused on nutritional elements as predictors of mortality in the elderly. Nutritional status has been measured by a multitude of indices, including ideal body weight, weight loss, serum albumin level, serum transferrin level, total lymphocyte count, cell-mediated immunity, and handgrip strength. But few studies focus on outcomes other than mortality. The elderly comprise an ever-increasing percentage of the total population. The number of people over age 65 reached 28 million in 1984 and this number will more than double by the year 2020. Mary Catherine McEllistrum, MD, and her group studied the importance of serum albumin as one barometer of nutritional status among patients in a VA hospital Intermediate Care/Geriatric Evaluation Unit.3 Serum albumin levels were compared with several discharge dispositions: return home, nursing home, boarding home, rehabilitation, transfer to acute care, and/or death. In addition, serum albumin levels were analyzed with reference to length of hospitalization, diagnosis, and age. This study was a retrospective chart review. Data were collected from all 148 patients who were admitted to an acute care ward, transferred to the Intermediate Care/ Geriatric Evaluation Unit once their condition was stable, and discharged during 1991. The acute care ward hospitalization ranged from one to 398 days, with a mean of 28.4. Length of stay on the Intermediate Care Unit ranged from one to 248 days, with an average of 39.4. The total length of stay proved out to be from 8 to 418 days with an average of 67.4. Each patient's nutritional status was assessed by admission serum albumin level. The albumin levels ranged from 1.5 to 4.7 g/ dl (mean 3.42). On admission, classification of patients by physician's diagnosis included complex medical problems, head/neck cancer, lung cancer, other cancer, ortopedic problems, stroke, vascular disease, and dementia. There is a significant inverse correlation of albumin on total length of stay, as well as a number of days spent on the acute care ward. An albumin value of > 3.5 g/dl was correlated with a more favorable disposition. Albumin level was not associated with diagnosis or age. Perhaps an increase of serum albumin levels during hospitalization would have improved outcome. What we learn from this kind of profile is that, in many cases, one variable can be used and its significance linearly disposed. In this case, it is serum albumin and the higher it is the better. The Current Common ConceptThe triad of hypertension, hypercholesterolemia and tobacco consumption is an example of a common and traditional risk analysis for cardiovascular disease (Figure 1 ).4 Shown are the three traditionally recog 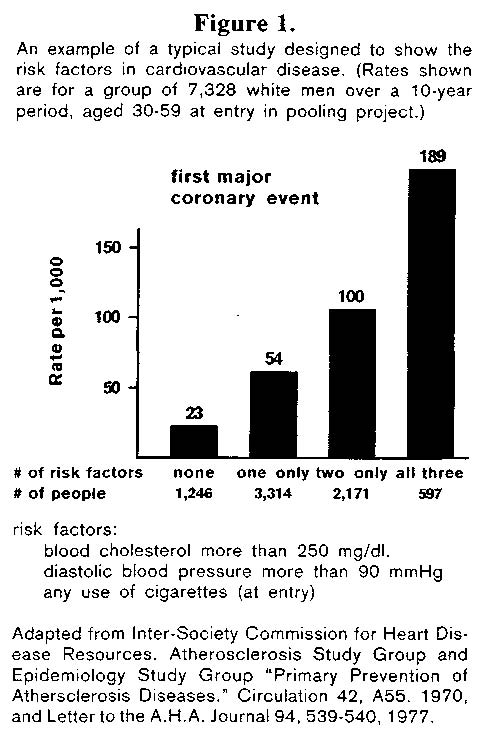 nized variables: serum cholesterol more than 250 mg%, diastolic pressure greater than 90 mmHg and use of cigarettes. The evidence suggests that if one is free of all three of these risk factors then there is a relatively low apparent rate (23/1000) of first major coronary events. If we are beset by either a serum cholesterol above 250 mg% or a diastolic pressure which exceeds 90 mmHg or we smoke, then the risk factor doubles (54/1000). When two of these three factors obtain, the risk doubles again (100/1000). Finally, with all three the risk practically doubles once more (189/1000). For many, this is the standard risk profile for heart disease. Risk appraisals like this suggest the multifactoriality element. But, they maintain a linear relationship. In the case of this profile, cholesterol and hypertension are of greater risk as they rise and, it is assumed, that the lower they would be the less they would contribute to heart disease. The ultimate expression of the cardiovascular profile is shown in a review of the literature. In one such analysis, 246 factors Predictive Medicine: The Story of Odds and Ends were cited in 828 references.5 A subsequent paper by these same authors adds another 30 to 40 risk factors.6 Though cause and effect relationships have not been demonstrated for the vast majority, consideration of these factors provide clues to CHD etiology and insight into possible preventive measures. For the convenience of clinicians and investigators interested in CHD, the almost 300 factors associated with CHD are summarized in ten categories: (1) constitutional and demographic factors, (2) environmental exposure, (3) habits, lifestyle and psychosocial factors, (4) physical and biochemical measurements, (5) serum or blood parameters, (6) platelet and coagulation tests, (7) medical conditions, (8) dietary excesses and positive associations, (9) dietary deficiencies and inverse associations or possible protective factors, and (10) drug liabilities. The only criterion for inclusion of a factor was finding at least one publication suggesting a positive or inverse association with CHD. Studies in support of the factors are classified a-g as follows: (a) prospective studies, (b) angiographic and autopsy investigations, (c) retrospective case control reports,
The New Predictive ModelThe term risk factor is widely used sometimes with different connotations. In the strictest sense, a risk factor should be associated with the disease. It does not have to be a direct cause of the pathologic process. There is another set of definitions. Risk indicators are associated, though they may not be casual, with a particular disorder. However, to be a risk factor, there must be a casual relationship. Causality can only be proven by intervention trials. In our earlier discussions, the risk indicators or factors were linearly disposed. It was suggested that if high cholesterol were bad. low should be good. It was intimated that if high blood pressure is bad, then low must be acceptable. It is well known that mortality rates for coronary heart disease and total serum cholesterol levels are lower among Japanese than among people in western countries. Japan, however, has had a higher mortality rate for strokes than western countries. Apropos, a study by Ueshima and his cohorts was carried out for ten years based on several epidemiologic surveys of cerebrovascular and cardiovascular disease in various populations of 6500 men with different lifestyles.7 One group, mainly farmers, had the highest incidence of strokes and the lowest mean levels of serum cholesterol (155 mg/dl in men aged 40-59). Both groups of industrial manual workers and clerks showed the lowest incidence rate of strokes and their average serum cholesterol levels were between 180 and 200 mg. A group of executives who displayed the highest total mean serum cholesterol level (200 mg/dl), had the highest incidence rate of coronary heart disease among all the study subjects. It would appear (Figure 2) that there is clearly a 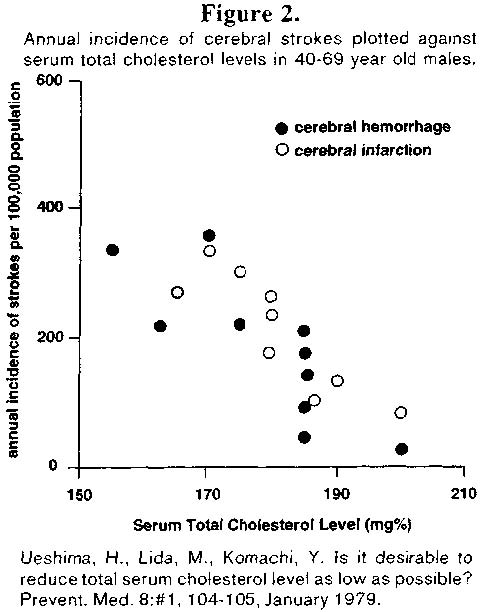 significant negative correlation between average serum cholesterol levels and the incidence of strokes. Hence, the negative linear relationship suggests that, to preventstrokes and cerebral hemorrhages, it may be better to keep the level of serum cholesterol not as low as generally held. These observers conclude that the desired serum cholesterol level should be somewhere between 180 and 200 mg/dl. Since both high and low cholesterol levels seem to be associated with disease (cardiovascular and cerebrovascular), it appears that serum cholesterol anddisease are not linearly but parabolicallyrelated. This failure in our current risk analysis is further heightened by the following experiment. To understand this philosophic point, let us go to London and look at a study byDoctor W. E. Waters. What Professor Waters did (Figure 3)8 was to take a group ofpresumably health women (n=180) who, as 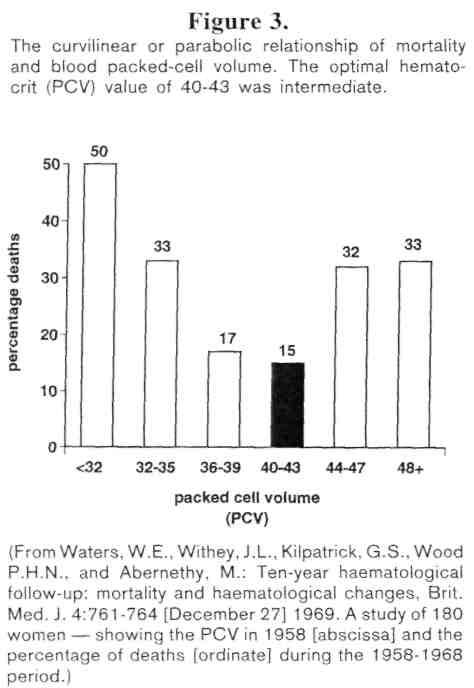 far as one could define, were considered healthy and performed the simplest of medical tests, the packed cell volume, the hematocrit. For those who are not familiar with this procedure, it requires simply putting whole blood into a graduated tube, centrifuging the tube so that the red cells, being heaviest, settle at the bottom and then measure the percentage of red cells in the tube. What Doctor Waters did was to perform this simpletest back in 1958. Approximately ten years later, he went back to find out what happened to those women. Of the women who had a hematocrit under 32%, half were now dead. Among the women who had a hematocrit just a bit higher, 32 to 35%, 33% were dead. Women who had a hematocrit just a wee bit higher still, 36 to 39%, 17% were deceased. And those with a hematocrit within a very narrow range, much narrower than we traditionally accept as being"normal," the death rate was lowest. Beyond,that point, the death rate starts up again inparallel with an increase in hematocrit. What this simple experiment says is that it is bad to have a high hematocrit, it is bad to have a low hematocrit, and there is something in between, within a very narrow range, that seemsto be most acceptable. So that from a risk profile standpoint, one could say that a hematocrit within this rigid normal range, muchnarrower than we were taught (we were usually told it is somewhere between 35 and 45 to 47), we shall fare best. Finally let us take a common clinical factor, sleep. The number of hours of sleep and mortality figures as determined in over amillion men was studied by insurance companies (Figure 4).9 The highest mortality 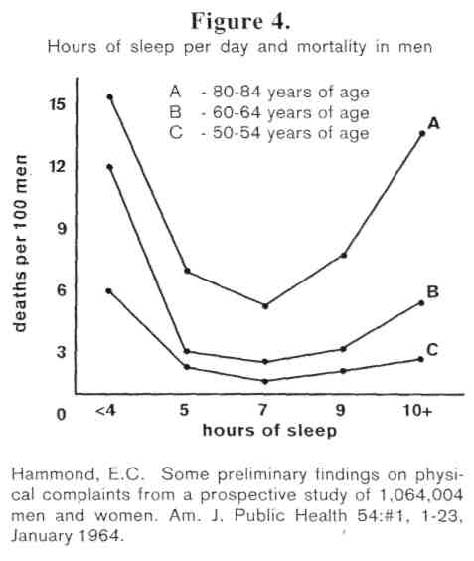 rate prevailed in those who sleep the least, under four hours, and the most, 10+ hours, a night. The mortality rate is of an order of about one third as bad in those who sleep five hours. Seven hours seem to be the ideal. As far as we know, there is not a physiologic or biologic or biochemical phenomenon that does not follow the parabolic pattern, the curvilinear design. The APACHE SystemSince 1981, several severity scores have been proposed for intensive care unit patients. The first ones (Acute Physiology and Chronic Health Evaluation referred to as APACHE or APS,l0 APACHE II,'' and Simplified Acute Physiology Score, SAPS12) were built by a subjective method, using a panel of experts to select variables and weights. More recent systems (Mortality Probability Model, MPM,13 and APACHE III14) use statistical modeling techniques to select and weigh the variables and risk of death is estimated through the use of a multiple logistic regression model. The purpose of the acute physiology score (APS or APACHE) is to facilitate multicenter studies and reliable outcome comparisons in patient groups of similar pathology. APS is calculated from 34 physiologic measurements. A value of 0-4 is assigned to each variable according to its degree of abnormality, and the APS is the sum of the assigned weights for all measurements recorded. Although APS is generally accepted as a reliable estimate of severity of illness in individual patients, variations in the mean number of data collected per patient may introduce a systematic bias in patient scoring because missing variables are interpreted as normal. It seems appropriate therefore, to select a standardized subgroup of routinely available measurements which would give unbiased results. Le Gall and his group used 14 easily measured biologic and clinical variables to develop a simple scoring system reflecting the risk of death in ICU patients.12 The simplified acute physiology score (SAPS) was evaluated in 679 consecutive patients admitted to eight multidisciplinary referral ICUs in France. Data were collected during the first 24 hours after ICU admission. SAPS correctly classified patients in groups of 29 increasing probability of death, irrespectiveof diagnosis, and compared favorably with the APS, the more complex scoring systemwhich has also been applied to ICU patients.SAPS was a simpler and less time-consuming method for comparative studies and management evaluation between different ICUs. The SAPS variables were specificallyselected to evaluate, directly or indirectly, the majority of systematic failures encountered in ICU patients. A trained data collector or ICU nurse took only about one minute tocollect the relevant data, compared to sixminutes for APS. Thirteen values, plus age, were selected. A value of 0 to 4 was assignedto each variable according to its degree ofabnormality. Four represents the greatest deviation at both extremes, tachycardia andbradycardia (Table 1). What is critical here isthat this demonstration once again underlines the utility of the curvilinear concept. 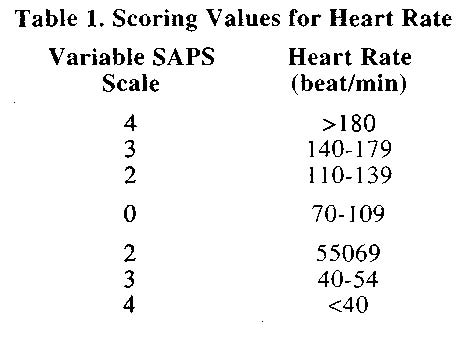 Summary and ConclusionsThere is a plethora of literature about odds and ends. Some of them are very simple, deal with single risk factors and determine single outcomes. The role of serum albumin described in this report is a superb example of this type of odds/ends combination. At the other extreme, there are very complicated profiles. The work of Hopkins and Williams is an excellent example of how complex some of our profiles and their outcomes can be. From our experience, a negative is always a negative. We know of no disease that goes unharmed by tobacco. We are not aware of any syndrome that is unscathed by simple sugars. Our experience suggests that reasonable physical activity is good for all metabolic processes. We have reason to believe that, if and when studied, vitamin C influences favorably all cells. Utilizing this concept, it is our feeling that, someday we shall be able to construct the profile of profiles, the syndrome of sickness. References
Haematological Follow-up: Mortality and Haematological Changes. British Medical Journal 4: #5685, 761-764, 27 December 1969. 9. Hammond, C.E. Some Preliminary Findings on Physical Complaints from a Prospective Study of 1,064,004 Men and Women. American Journal of Public Health 54: #1, 1 1-23, January 1964. lO.Knaus, W.A., Zimmerman, J.E., Wagner, D.P., Draper, E. A., Lawrence, D.E. APACHE - Acute Physiology and Chronic Health Evaluation: A Physiologically Based Classification System. Critical Care Medicine 9: #8, 591-597, August 1981. 11.Knaus, W.A., Draper, E.A., Wagner, D.P., and Zimmerman, J.E. APACHE II: A Severity of Disease Classification System. Critical Care Medicine 13: #10, 818-829, October 1985. 12.LeGall, J.R., Loirat, P., Alperovitch, A., Glaser, P., Granthil, C, Mathieu, D., Mercier, P., Thomas, R., and Viller, D. A Simplified Acute Physiology Score for ICU Patients. Critical Care Medicine 12: #11, 975-977, November 1984. 13.Lemshow, S., Teres, D., Klar, J., Avrunin, J.S.,Gehlbach, S.H., and Rapoport, J. Mortality Probability Models (MPMII) Based on an International Cohort of Intensive Care Unit Patients. Journal of the American Medical Association 270: #20, 2478-2486, 24 November 1993. 14.Knaus, W.A., Wagner, D.P., Draper, E.A., etal. The APACHE III Prognostic System: Risk Prediction of Hospital Mortality for Critically Ill Hospitalized Adults. Chest 100: #6, 1619-1636, December 1991. 30 |

This website is managed by Riordan Clinic
A Non-profit 501(c)(3) Medical, Research and Educational Organization
3100 North Hillside Avenue, Wichita, KS 67219 USA
Phone: 316-682-3100; Fax: 316-682-5054
© (Riordan Clinic) 2004 - 2024c
Information on Orthomolecular.org is provided for educational purposes only. It is not intended as medical advice.
Consult your orthomolecular health care professional for individual guidance on specific health problems.
 Download The Full Text Article in (PDF)